
 When did the Department of Geology and others start monitoring Boone Creek stream temperatures?
The idea for the study of water quality and stream discharge in Boone Creek began in 2005 by a chance meeting of three ASU scientists at a meeting about stream restoration on the ASU campus. There were several initiatives at the time to develop stream restoration projects in an attempt to return Boone Creek to a more pristine condition. Bill Anderson (Geology), Chris Thaxton (Physics and Astronomy), and Carol Babyak (Chemistry), who were relatively new to campus at the time, realized that these restoration decisions were being made without any water quality or flow data for the stream. They teamed up to collect baseline water quality and stream discharge data in order to see what the real conditions were in the stream. This initial study was supported by the scientists’ departments as well as funding from the ASU URC and the College of Arts & Sciences.
Where were stream data initially collected?
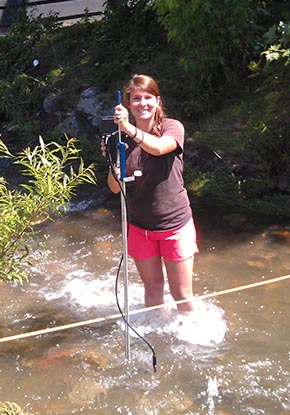
Two field sites were established early in 2006 and data collection began on 09 March 2006. The two initial sites, one at Jimmy Smith Park and one at the ASU Steam Plant, were chosen mainly because of ease of access. Unlike our current monitoring style, these sites comprised wells placed directly into the stream. Each well was outfitted with a multi-parameter probe that measured stream depth, temperature, electrical conductivity (salinity), pH, turbidity, and dissolved oxygen. These data were measured all day, every day, at 15-minute intervals. ASU geology students were also put to work to develop rating curves, which became the basis of converting stream depth (stage) to stream discharge, or volumetric flow. Two additional sites, one upstream of the North Carolina Cooperative Extension office and the other at the last bridge downstream in Durham Park, were added briefly in late 2007 until Summer 2008. These sites measured stream depth, temperature, and electrical conductivity (salinity).
What were the initial findings?
The initial data were enlightening. Water quality conditions in Boone Creek were surprisingly good. Although there were fears about sedimentation in Boone Creek, which is the basis for much of the support for stream restoration in the stream, stream turbidity, or the measure of the water’s cloudiness, was not an issue and was actually fairly low. pH levels were also normal. Three components of the data, however, did stand out: (1) the flashiness of the stream discharge, (2) the high stream temperatures during the warm spring, summer and fall months, and (3) the salinity levels in the stream.
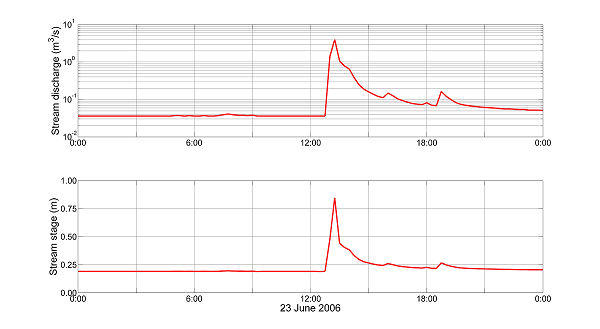
The flashiness, or the rapid rise and fall of the stream during storm events, was not all that surprising: headwaters streams, especially those in areas of steep topography, tend to respond rapidly to rainfall events. The fact that Boone Creek is in an urban setting made the event flashier due to the urban infrastructure (e.g., storm sewer system, building drainage systems, pavement, etc.), which prevents about 25% of the rainwater from infiltrating into the ground. For an example of the flashiness of the stream, consider the figure below that shows the storm of 23 June 2006, which was a typical summer afternoon thunderstorm. Shortly after the beginning of the storm event, stream levels rose about 0.6 m, causing a jump in stream discharge from 0.036 m3/s to 4 m3/s, an increase of two orders of magnitude.
Were there any surprises in the data?
There were surprises in the data. Because we began monitoring the stream at the beginning of the spring, the initial measurements showed that stream temperatures were relatively cold, as was expected. However, as soon as we began to have warmer days, we noticed increasing stream temperatures. By the time that afternoon thunderstorms began, we noticed temperature spikes in the data. These spikes would occur during and after the onset of a thunderstorm, which because of the impervious surfaces in town and on campus would cause a rapid increase in stream stage and temperature within minutes. The figure below shows data collected during Summer 2010. As the data show, most days there is a rise in stream temperature during the day, peaking at approximately 3:00 pm before declining overnight. Temperatures begin to rise the next morning by 6:00 am. Upon closer inspection, however, there are some exceptions to this general trend. The first of these shows up on 08 April, when shortly after noon the temperature rises approximately 2 °C within the 15-minute sampling rate. More careful inspection of the data indicates that there were 44 events during Summer 2010 in which stream temperatures rose at least 1 °C within 15 minutes. This is the criterion on which we base a temperature surge event.
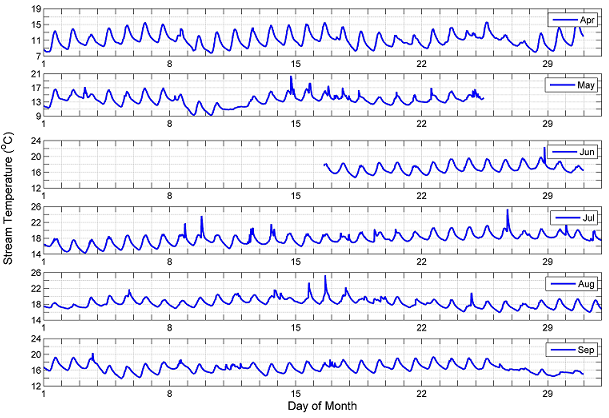
The next figure focuses on 25 to 27 July 2010 when the largest temperature surge occurred during Summer 2010. The first day’s data shows a typical sinusoidal oscillation in stream temperature with a minimum temperature of 18 °C at around 4:00 am and a peak in stream temperature at approximately 4:00 pm. The next day, 26 July, behaves completely differently. Stream temperatures begin to rise with the onset of daylight as usual; however, around 3:00 pm the stream temperature flattens, perhaps in response to increasing cloud cover. By 6:00 pm, a storm event arrives and stormwater runoff heated by the impervious surfaces in town and on campus causes a nearly instantaneous rise in stream temperature of approximately 5.6 °C. Although there is a bit of disruption on the 26 July, there is still a fairly normal temperature behavior on the day after the storm.
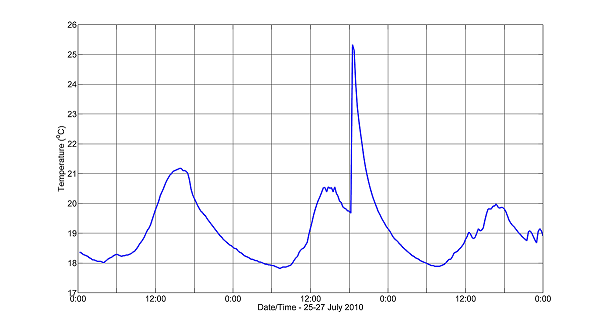
This storm event is an excellent example of thermal pollution. It is caused by the urban infrastructure, which is designed to remove rainwater as rapidly as possible from roads and roofs and direct it to streams. The problem with this type of design, especially in relatively small headwater streams like Boone Creek, which lacks thermal inertia due to its small discharge rate, is that the heated runoff completely overwhelms natural stream temperatures, which are stabilized by relatively cool and consistent groundwater discharge temperatures. This can have severe consequences for the natural environment. Aquatic species that have adapted to the natural cold water environment of mountain streams are not able to handle these temperature stresses. The small size of these streams leaves few locations for these species to hide during the thermal pollution event.
What is the status of the stream temperature monitoring now?
The Department of Geology, including many undergraduate students, has continued to monitor stream temperatures since the initial three gauging sites were established. We have expanded to include sites throughout the watershed from the Agricultural Extension Office upstream of downtown to Durham Park just before the stream goes under Rivers Street. We have also expanded our measurements to several tributary streams. As of Fall 2014 we have 24 stream temperature monitoring sites.
What can be done about the excessive stream temperatures in Boone Creek?
There are several things that can be implemented to reduce stream temperatures in Boone Creek. The day-to-day problem of elevated stream temperatures can, in part, be attributed to a lack of riparian, or stream-side, vegetation along Boone Creek. The lack of riparian vegetation along Boone Creek is somewhat surprising given Appalachian’s ‘green’ reputation, as is the continued practice of cutting vegetation down to the stream’s edge; however, this is a problem typical of urban watersheds and that is the current fate of Boone Creek. The Appalachian campus has a wealth of green space, especially in Durham Park and along the area between Varsity Gym and Rivers Street, which would be ideal for the establishment of a proper riparian vegetation corridor. The daylighting of Boone Creek beneath the Raley Parking Lot, between Jimmy Smith Park and Varsity Gym, would further enhance the thermal quality of Boone Creek on a daily basis. The university should make this a priority in order to enhance the ‘green’ reputation.
The problem of temperature surges is a more difficult problem to fix. As the Appalachian campus and the Town of Boone grew within the watershed of Boone Creek, stormwater management was essentially just a problem of moving rainwater from pavement and buildings directly to the stream. Thus, there really is no infrastructure to handle the volume of stormwater runoff that is created with each storm event. In fact, over 70 outfall pipes, funnels and drains were observed during a casual walk along the 1.5 km study reach in 2005. Temperature spikes could be reduced, or eliminated, with proper stormwater management techniques including storage of heated runoff until it has time to cool.
 Have the data contributed to any scientific publications?
A number of peer-reviewed publications, professional talks and senior theses have come out of the stream temperature data collection work. The senior thesis of Mr. Joey Anderson ’08 was turned into a publication by the Journal of Hydrology in 2010. His work focused on the effects that the daylighting of the Raley Parking Lot would have on stream temperatures. The research of Ms. Rachel Storniolo ’10 was published by the Journal of Hydrology in 2011. Her model-intensive work examined the influence of natural heat-attenuation by stream banks during flood events. Independent research by Mr. Joshua Rice ’11 appeared in the journal Hydrological Research Letters in 2011. His work looked at the relationships between levels of urbanization and stream temperatures in small, headwater streams. In addition to these efforts, at least 11 student-authored and eight faculty-authored talks and posters have been presented at professional meetings since the beginning of the data-collection effort.
What are the future plans for data collection and analysis?
The Department of Geology will continue to collect stream temperature data for the foreseeable future. The long record of stream temperature data from Boone Creek is a treasure trove of information for studies of not only headwater streams and urban hydrology, but also of the influence of climate change on stream temperatures. We hope to turn the nearly ten-year-long dataset into at least a 20-year-long dataset.
How can students get involved?
Students have been part of the Boone Creek study from the beginning. At least ten students have contributed significant amounts of their time to the project over the past nine years. The Water Resources Research Group in the Department of Geology is always willing to speak with interested students about our work in Boone Creek and other research projects far and near. Please contact Dr. William Anderson at andersonwp@appstate.edu or Dr. Chuanhui Gu at guc@appstate.edu for more information about getting involved in our research.