
What are typical modes of salt contamination of surface and groundwater resources?
When one thinks about the potential for salt contamination of water resources in North Carolina, coastal streams and coastal aquifers likely come to mind. Flooding of the land surface from the ocean during hurricanes and Nor’easters are relatively common phenomena on the North Carolina coast and these can provide direct sources of salt contamination. In fact, in the weeks following Hurricane Emily in August 1993, the water supply of lower Hatteras Island, including the villages of Avon, Buxton, Frisco and Hatteras Village, was above the legal limit for chloride concentration of 250 mg/L. Overpumping of groundwater resources in coastal settings can also induce saltwater intrusion either quickly in shallow coastal settings near oceans or sounds or more slowly in deeper aquifers, such as is occurring in the layered aquifers of the Coastal Plain of North Carolina.
 Are there other modes of salt contamination?
Inland areas may be subject to salt contamination for different reasons. In some formerly glaciated areas, regions of the interior that were once covered with seawater may still contain pockets of trapped seawater in the subsurface. This is a problem that has been documented in the New England state of Maine and elsewhere. The more common source of salt contamination, however, is the use of road salt. The effects of road salt application on water quality has been known to be a problem for decades in many northern regions of the United States, such as the Midwest and New England, where harsh winters require the use of road salt. A 2015 paper by Corsi et al. in the journal The Science of the Total Environment confines their study to the northern United States, with a control site in the south, because of the prevalence of contamination in the north. The application of salt to roadways creates a non-point source pollutant, where it can find a variety of flowpaths to aquifers and streams. Another way that road salt has caused contamination has been through point source pollution from salt piles. In the past, before the ubiquitous pyramidal salt storage buildings were constructed, road salt was stored in the open or inside inadequate storage buildings and it easily seeped into the subsurface, contaminating aquifers and forcing many states to purchase water supplies for the rural residents who were affected.
So, salt contamination of water resources sounds reasonable for eastern North Carolina and northern states with harsh winters, but the Blue Ridge?
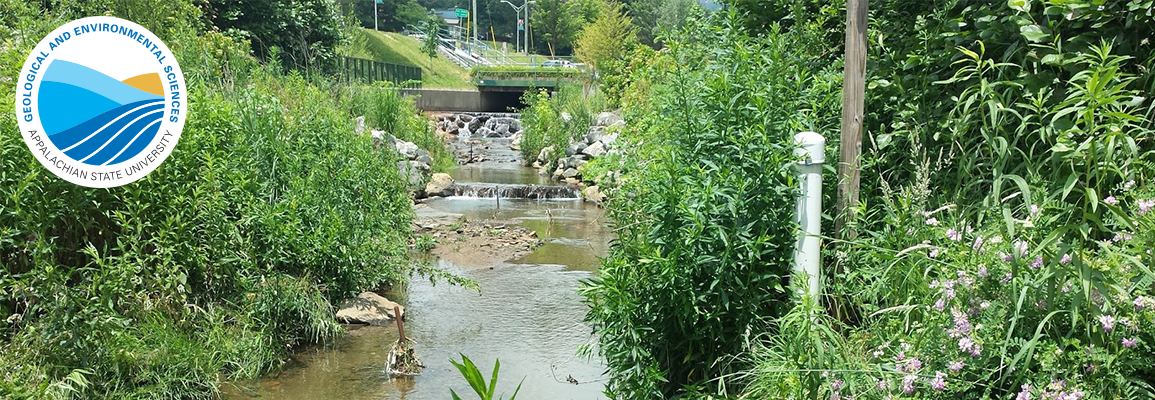
Western North Carolina is seemingly the least likely place for salt contamination given the pristine mountain streams that most people envision when they think of the Blue Ridge Mountains and the High Country. However, our relatively high elevation and frequent ice and snow means that, unlike most regions of the southern U.S., we use quite a bit of road salt each winter. Our physical setting compounds the potential contamination effects within the Town of Boone because our steep slopes, coupled with urbanization, which is the amount of impervious surface area such as roads, parking lots and buildings, means that much of our water runs off rapidly. The application of salt lowers the freezing point of water, so even if air temperatures are below the freezing point of water, we may still have meltwater runoff; however, unlike during the summer, this water will contain dissolved road salt.
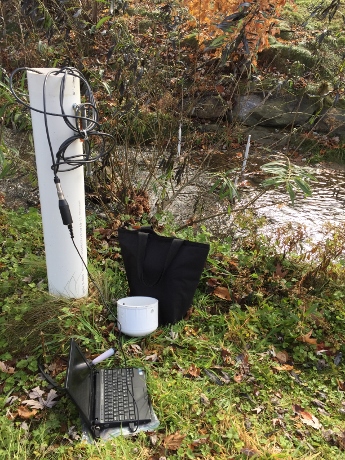
Kelli Straka ’15, a senior in the Department of Geology, has been monitoring saline contamination of Boone Creek since Summer 2015. Through grants from the Office of Student Research and funding from the Department of Geology, the monitoring network has increased to four electrical conductivity sensors along the length of Boone Creek through the Town of Boone and the ASU Campus. The picture to the right shows her typical field setup when downloading data.
How is road salt applied to pavement?
The bulk of road salt is applied to roadways by salt trucks by the Town of Boone and the N.C. Department of Transportation to the roads of the region. A smaller amount is applied on sidewalks by four-wheel utility trucks or by hand. It is the hand applications that can potentially be applied in a non-uniform manner, leaving random piles throughout the Town of Boone and the ASU campus.
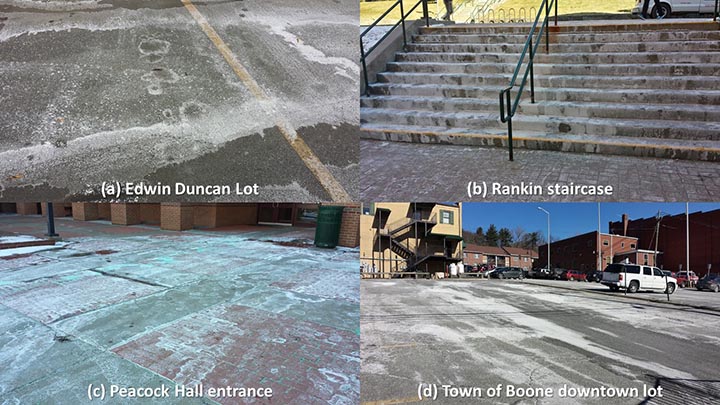
The pictures below show road salt applications at various sites around the Town of Boone and ASU campus. It should be fairly obvious that not only is the salt not applied in a uniform manner, but it also persists on the pavement long after the ice event that caused the salt to be applied in the first place. Given leftover salt in the environment shown in these photos, it is easy to imagine that with the next precipitation event the remaining salt will flow as runoff to Boone Creek fairly quickly. This rapid type of saline contamination can be thought of as an ‘acute’ saline contamination. The U.S. EPA classifies acute saline contamination as having chloride values of at least 860 mg/L over a one-hour average.
The cost of road salt application should also be kept in mind. Not only is saline runoff detrimental to the ecosystem services of our local streams, including Boone Creek, an impact that is not easy to quantify financially, but it also has real financial impacts. First, of course, is the cost to purchase the road salt. This will vary year to year based on the severity of a particular winter season, but it will also vary with the skills and efficiency of the people applying the salt. A second cost is the effect that the salt has on the urban infrastructure of the area. Looking at the photos of the Rankin staircase and the entrance to Peacock Hall, it is easy to imagine that the salt is having a corrosive effect of the concrete and metal, requiring those materials to be replaced at a higher rate than if no salt, or less salt, was applied.
Is direct runoff of meltwater along the surface the only means of transport of the salt to Boone Creek?
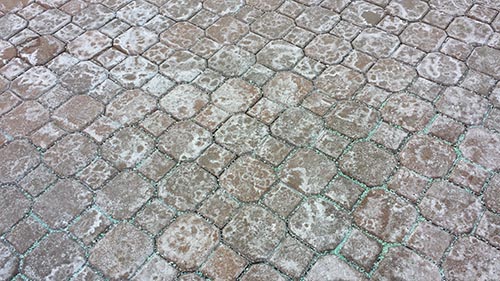
Direct runoff of meltwater laden with salt is the easiest salt transport pathway to conceptualize, but a more chronic pathway is through groundwater discharge as baseflow to local streams. Consider the photo below, which shows a close-up of salt on a brick walkway on the ASU campus. Note the large green salt crystals in the cracks in the pavement. This salt will gradually dissolve, seep through the spaces between the bricks, and eventually recharge the groundwater system. This groundwater will flow, over time, to the nearest stream, which in downtown Boone is Boone Creek. When considering the entire region, pathways such as this are widespread and contribute a non-point source saline contamination to local waters. Because this source of contamination tends to smooth out over the course of a year, this can be thought of as a ‘chronic’ mode of saline contamination. The U.S. EPA classifies chronic saline contamination as having chloride values of at least 230 mg/L over a four-day average.
What are the current salinity conditions in Boone Creek?
The Department of Geology started monitoring stream salinity levels in Boone Creek at two locations-Jimmy Smith Park and Varsity Gym -in July 2014. A monitoring site in Durham Park was added in October and another site upstream of the Agricultural Extension Office was added in January. These stations measure electrical conductivity, from which chloride concentrations can be approximated, at 15-minute intervals. Previous electrical conductivity measurements were done by the original Boone Creek research team from 2006 to 2008. These measurements were taken within a well screened in the stream, and although the dataset was interesting, initial research efforts focused on stream temperatures.
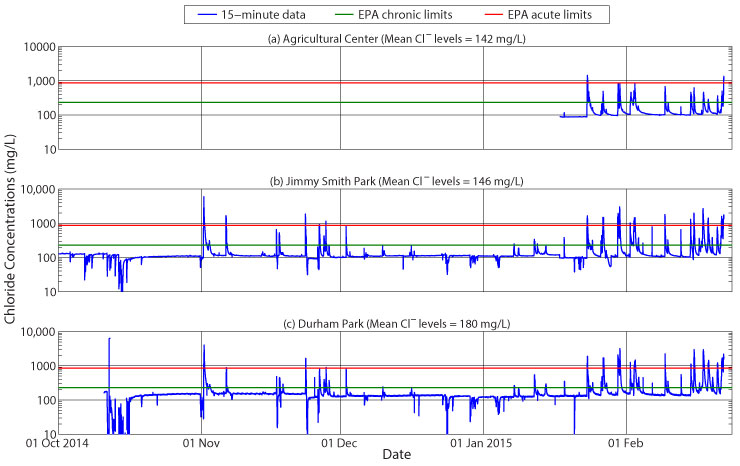
The figure below shows approximate chloride levels in Boone Creek as measured at (a) the Agricultural Center, (b) Jimmy Smith Park, and (c) Durham Park monitoring sites. Also shown in each panel are the chronic and acute chloride standards as established by the US EPA. Based on the number of peak flow events, it is apparent that a number of large chloride events occurred during the monitoring period, mostly at the end of January and during February. The chloride data show the effect of the groundwater flow path on chloride transport – note that the values hover around a mean concentration at each site except during storm events, when, if it is not a snow or ice storm, the fresher runoff water dilutes the stream chloride levels down to levels, in some cases, below 10 mg/L. This fresh dilution occurs because no salt has recently been added to the streets and sidewalks and they are essentially ‘clean.’ Note also that with each large storm event-mid-October is the most obvious example-the elevated runoff rates actually dilute the chloride baseflow significantly, enough that the rates do not have time to recover before the salt season begins on 01 November. This is likely due to flood water flowing into the stream banks during elevated stream levels. The time required for this water to return to the stream causes long-term dilution of the salt signal.
The actual ‘salt season’ began on 01 November. Note that this storm, which was not very large in terms of stream flow, initially diluted the stream chloride levels; however, after a drop in temperatures and an application of road salt to the infrastructure, runoff brought this source of chloride immediately to the stream. The chloride levels actually spiked above 5000 mg/L, well above the US EPA’s acute water quality standard of 860 mg/L. After this initial salt source event, each subsequent storm has provided some change in chloride levels in Boone Creek, the storms of late January and February causing the most activity. Careful analysis of the signal also shows that the chloride spikes in Boone Creek sometimes are preceded or followed by dilution, which occur when there is no longer a source of salt on the pavement.
Another interesting aspect to the data are the increasing mean chloride concentrations with distance downstream. The Agricultural Center lies fairly far upstream, and the mean concentrations of just the winter levels are the lowest at 142 mg/L. Note, however, the initial week of data, when chloride concentrations hover slightly below 100 mg/L. This is the chloride concentration in the groundwater at that location. With a longer dataset, it will likely be the mean concentration of chloride at the Agricultural Center. As one proceeds downstream to Jimmy Smith Park, urbanization increases and mean chloride levels rise to 146 mg/L. This shows the influence of runoff from a majority of downtown Boone. By the time the stream gets to Durham Park, the full effects of runoff from both the Town of Boone and the ASU campus are evident as mean chloride concentrations rise to 180 mg/L. This is almost twice the groundwater concentrations at the Agricultural Center and is approaching the chronic water-quality standard of 230 mg/L.
Have baseflow-transported chloride levels been consistent over the period of observation?
Here you can see a comparison of summer (July and August) approximated chloride values for monitoring years 2006, 2007 and 2014. Please note that the relative ‘smoothness’ of 2006 and 2007 data relative to the 2014 data is due to the fact that the instruments in the first two years were housed in monitoring wells that were screened in the stream. The screens act to filter small variations in the signal, but they do not affect the overall trends in the data.
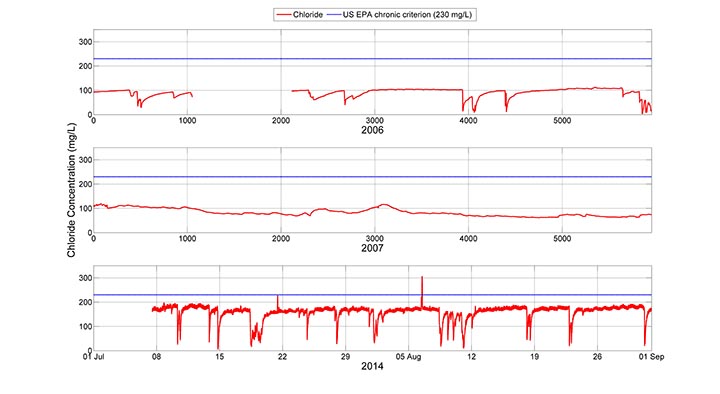
The most obvious take home message from the three panels in the figure is that the summer baseflow chloride concentrations have nearly doubled in the seven years since the collection of the 2007 data, from an average of approximately 100 mg/L in 2006 and 2007 to the current range of 160 to 170 mg/L when storm events are not diluting the signal. This suggests that either (1) more salt is being used each year, thereby raising the baseflow salinity levels, or (2) the peak groundwater chloride levels have not yet been met. The first option is likely. The Town of Boone and the ASU campus have seen additional development in the watershed. In addition, the campus has grown by 20% in this time period, increasing from approximately 15,000 to 18,000 students. Another notable difference in the data is the variation in the shapes of the signals in 2006 and 2007. The summer of 2007 was very dry, so very few dilution events occurred, unlike in 2006, when a number of them occurred.
Has Boone Creek reached chronic chloride levels yet?
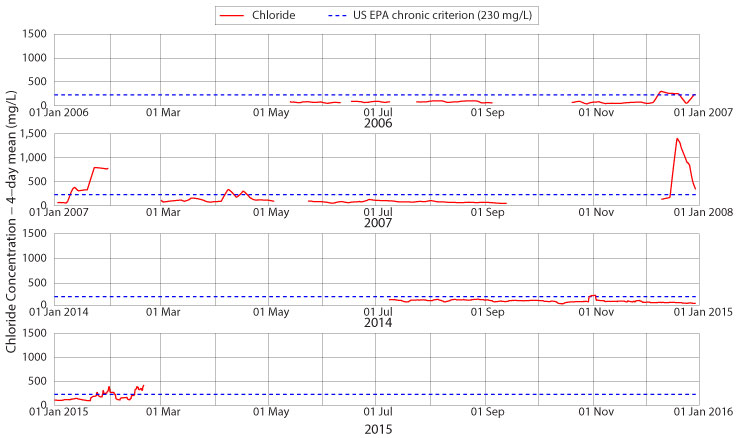
Not yet, at least not all of the time, but it is approaching that limit at the Jimmy Smith Park monitoring site and further downstream. Figure 5 shows four-day mean chloride concentrations for portions of 2006, 2007, 2014 and 2015. The lower values of baseflow in the first two years of monitoring are evident. Another notable feature of the first two years is that the winters were relatively stronger than the early part of the winter in 2014-15: note the above-chronic chloride concentrations in December 2006 (for half of the month) and January 2007 (for two-thirds of the month) and also the high four-day averages in December 2007. Winter 2014 started off mildly, and this affected salinity levels in Boone Creek until late January and February. Only the first storm of the season, around 01 November, saw chloride concentrations rise above the 230 mg/L chronic standard, and then only for a few days. This ceased to be the case as of late winter, when the chronic standard was violated for two full weeks.
Has Boone Creek reached acute chloride levels yet?
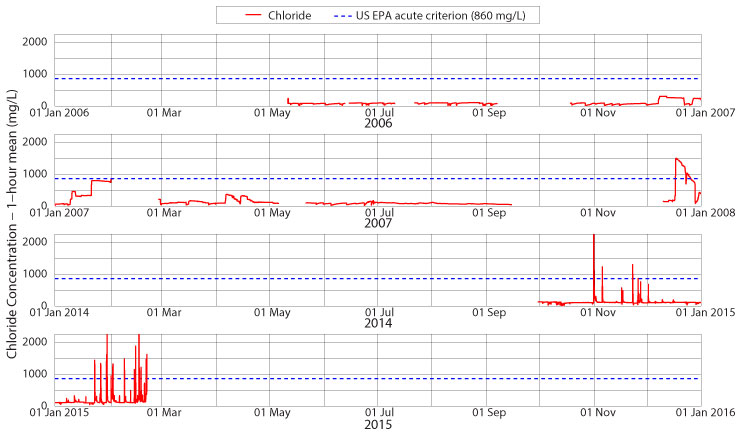
Acute chloride contamination requires a one-hour mean chloride concentration of at least 860 mg/L. Figure 6 shows chloride levels for portions of 2006, 2007, 2014 and 2015 at the Jimmy Smith Park monitoring site. As is fairly obvious in the figure, acute contamination occurs primarily after large salt applications. No summer monitoring has measured chloride levels above the acute target value. Some winter storm events also fail to reach this limit – for example, see December 2006 and January through April 2007 for examples. Large applications of road salt due to stronger winter storms do produce a saline response in Boone Creek. A large storm event in mid-December 2007 raises stream chloride levels above the acute limit, and these values lasted for two weeks. Early this winter, two individual storm events raised the one-hour mean chloride concentration above 860 mg/L, but these were short-lived events of only a few hours. The increased amount of snow and ice late in January and February 2015 and the application of road salt caused 13 violations of the US EPA acute chloride standards with a maximum one-hour mean of 4175 mg/L or nearly five times the standard. While these events are relatively short lived, averaging five hours in duration, they are still quite detrimental to the freshwater mountain stream habitat that we call Boone Creek. We will continue to monitor salinity levels to see if further storm events this winter cause longer-lasting acute contamination of Boone Creek.
Can salt levels in the watershed be reduced?
Other than limiting the amount of road salt that is applied to roads and sidewalks in the Town of Boone and the ASU campus, there is no other option for reducing the amount of salt reaching Boone Creek. Unlike stream temperature spikes, which can be limited by storing water in well-shaded retention ponds until the temperatures cool or by reducing the amount of runoff through the construction of rain gardens, there is no way to remove salt from runoff. Better management of the process and better training of those applying the salt could go a long way to reducing the amount of salt in Boone Creek.
How can students help with the Boone Creek salt study?
Students have been part of the monitoring efforts in Boone Creek since 2005. At least ten students have contributed significant amounts of their time to the project over the past nine years. The Water Resources Research Group in the Department of Geological and Environmental Sciences is always willing to speak with interested students about our work in Boone Creek and other research projects far and near. Please contact Dr. William Anderson at andersonwp@appstate.edu for more information about getting involved in our research.